How effectively monitor crude corrosivity and inspect susceptible equipment for potential damage.
Module Overview
Corrosion in Refinery
Crude Corrosivity
Module 4
Monitoring and Inspection
Build practical confidence through short lessons, guided decisions, and field-ready checks.
Duration10-15 minutes
FormatInteractive module
AssessmentKnowledge check
Updated30/09/2026
Module progress0%
Complete the module quiz to record progress.
Operational Scenario
New crude blend introduction - where to measure corrosion and with what methods
The refinery is introducing a new crude blend with higher acidity and sulfur content. CDU and VDU units are expected to be affected due to CS/5Cr metallurgy. Learners must determine where to measure corrosion and which inspection methods to use to assess potential damage.
Topics and Subtopics
Select a topic to explore its main ideas, practical considerations, and subtopics.
Monitoring and Inspection
Intrusive Monitoring
Explain key features and consideration for two popular intrusive monitoring methods: Coupons and Electrical resistance (ER) corrosion probes.
Key point: Select the best fit for purpose intrusive monitoring method
Intrusive method strengths
Insight view. Both coupons and ER probes provide direct measurements of fluid corrosiveness.
Budget-friendly. Low CAPEX and OPEX compared to more sophisticated monitoring techniques like permanent online UT sensors.
Proven. Coupons and ER probes have a long track record in corrosion monitoring and there is clear understanding of their outcomes.
Intrusive method limitations
Intrusive. Still need insertion into the process stream, hence dedicated access points are required.
Installation complexity. Installing coupons and ER probes into 'live' process streams requires specific procedures and trained personnel to ensure safety and proper operation.
Weight-loss corrosion coupons are removable metal specimens exposed to the process stream for a defined period. Their measured mass loss gives an average corrosion rate for the coupon material and exposure interval.
Example calculation CR (mm/y) = 87.6 x mass loss (mg) / [density (g/cm3) x exposed area (cm2) x exposure time (h)]
Select monitoring points from the corrosion-circuit review and the damage mechanism being assessed. Choose a representative, fully wetted location for the target stream; consider locations downstream of crude blending or mixing once the stream is representative, and locations associated with relevant temperature, flow, or phase changes. Add points where the expected damage distribution differs, rather than assuming one coupon represents an entire circuit. Avoid stagnant or poorly mixed locations unless they are the specific environment being investigated. Final locations, holders, insertion depth, and orientation must be approved for the actual process conditions and site procedures.
Screening notes
Use a coupon material that matches the target piping or document why a representative alloy is being used.
Record exposed area, material density, surface preparation, initial mass, holder location, orientation, and exposure start/end times.
Select exposure duration using the expected corrosion rate and the measurement procedure's resolution; there is no universal exposure period.
Use only an engineered access fitting and holder rated for the process pressure, temperature, fluid, and retrieval method.
Treat the result as an average mass-loss rate for that coupon and interval; it does not by itself identify localized attack or predict the rate everywhere in the circuit.
Advantages / Uses
Provides a direct, material-specific mass-loss measurement over the exposure interval.
The retrieved specimen can be examined for deposits, scale, and surface condition.
Relatively simple and economical where suitable access fittings are available.
Operational Constraints
Results are delayed until retrieval and represent an average over the exposure period, not a real-time rate.
A single coupon is local evidence and may not represent different flow regimes or damage locations in the circuit.
Installation and retrieval require a suitable engineered holder, access point, and approved site procedure.
Mass-loss results alone may not reveal localized corrosion, erosion, or the cause of the damage.
Electrical resistance (ER) probes estimate metal loss by measuring the change in electrical resistance of a probe element exposed to the process. They provide a time-based signal that can help identify changes in corrosive conditions between coupon retrievals.
Install the probe where the process is representative of the circuit and where the probe element sees the intended phase, temperature, and flow. Confirm the probe, access fitting, cable, transmitter, and data historian are suitable for the service and that the measurement location is protected from avoidable fouling or dead legs.
Screening notes
Match the probe element material and geometry to the monitoring objective; a probe is not automatically representative of every component in the circuit.
Establish a baseline after installation and allow for response time before interpreting a trend.
Check instrument health, temperature compensation, data gaps, and probe fouling before treating a change as a corrosion-rate change.
Use the ER trend with coupons, process data, and inspection results rather than as a standalone thickness measurement.
Advantages / Uses
Provides a repeatable online trend between inspection campaigns.
Can show a change in corrosive conditions earlier than a retrieved coupon.
Interpretation cautions
The signal reflects the probe environment and may not represent every location in the circuit.
Fouling, temperature effects, electrical noise, and probe geometry can distort the apparent trend.
Equipment and damage
Susceptible circuits and damage distribution
Screen the crude unit for locations where chemistry, temperature, velocity, metallurgy, and phase behavior combine to increase damage potential.
Key point: Prioritize representative measurement locations and high-consequence components, then validate the screening with inspection evidence.
Locations and indicators
High-temperature crude and vacuum circuits with susceptible carbon-steel or low-alloy steel metallurgy.
Changes in crude blend, acidity, sulfur content, temperature, velocity, or water and salt behavior.
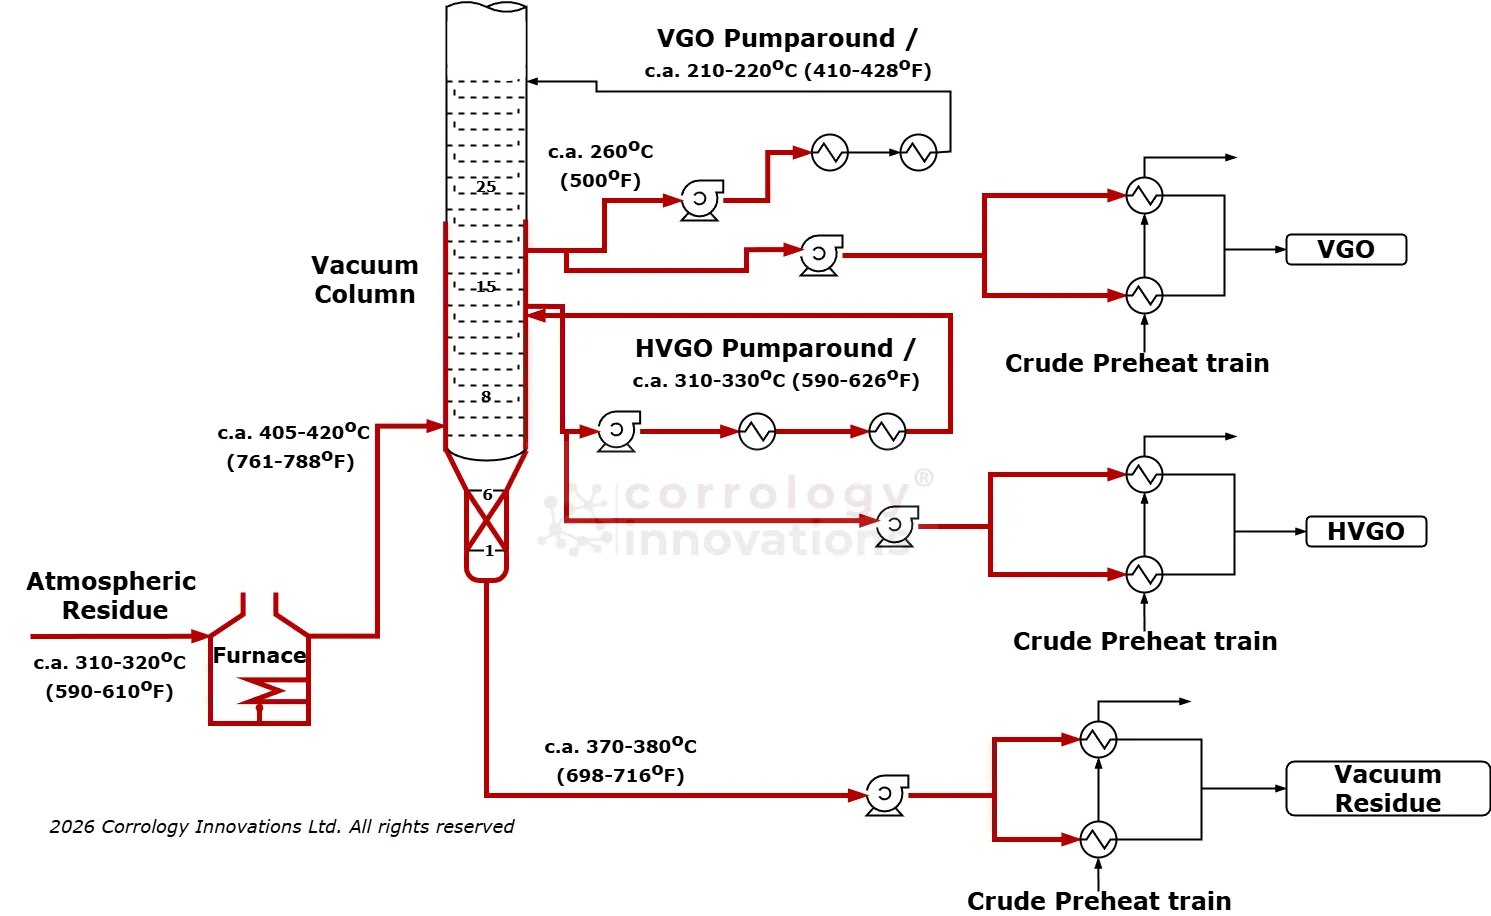
Elbows, reducers, pump-around circuits, transfer lines, and other locations where flow or phase behavior changes.
Inspection considerations
Bulk assay values do not describe local wall temperature, wetting, flow regime, deposits, or residence time.
A thickness reading or probe signal is local evidence and must be trended with consistent locations and methods.
Choose a method
Subtopics
Expand a method to explore
Screen | PrioritizeSusceptible circuits and componentsView details
Method briefing
Susceptible circuits and components
Start with the crude and vacuum unit circuit review. Mark hot transfer lines, furnace outlets, atmospheric and vacuum fractionator sections, pump-arounds, side draws, and downstream locations where temperature, velocity, mixing, or phase behavior changes. Then rank components using expected damage severity, inspection history, metallurgy, and consequence of failure.
Place monitoring points where the stream is representative and where the damage mechanism is expected to be active. Include more than one point when conditions change materially along a circuit; do not extend a local result across the entire circuit without supporting evidence.
Screening notes
Use current PFDs, P&IDs, circuit boundaries, operating envelopes, materials records, and previous inspection data.
Record the exact component, orientation, elevation, phase, temperature, flow direction, and measurement technique for each point.
Escalate unusual deposits, leaks, rapid trend changes, or unexpected damage morphology for engineering review.
Advantages / Uses
Connects monitoring locations to the actual damage mechanism and equipment risk.
Helps inspection teams focus coverage where a change in conditions can change the damage distribution.
Screening limits
A circuit screen is a prioritization tool, not proof that damage is present or absent.
Process changes and incomplete records can make an apparently low-risk location unsuitable as a reference.
Interactive Challenge
Interactive diagnostic case study
A new blend changes the monitoring picture
Decision point
A new crude blend raises TAN and sulfur while the CDU and VDU continue to operate near the upper end of their temperature envelope. An ER probe shows a gradual increase, but the latest coupon result is only an average rate. Decide what evidence to review before changing the inspection plan.
Illustrative corrosion signal after blend change
Diagnostic clues
Review the crude assay
Compare the blend history and assay data with the time at which the ER signal began to move. TAN is a screening indicator; it should be interpreted with temperature, sulfur chemistry, water behavior, metallurgy, and actual exposure.
Locate the susceptible conditions
The most useful next check is not simply another reading. Confirm the point's circuit location, metal temperature, phase and flow conditions, material, and whether the probe is representative of the component being assessed.
Reveal the explanation
Build a joined evidence set
The ER trend is an early warning, not a complete diagnosis. Review blend and operating history, confirm instrument health and point representativeness, compare coupon and thickness data, and check whether deposits or localized attack could make the local result more severe than the average rate suggests.
Recommended action: Validate the monitoring point and trend, then target follow-up thickness examination or coupon retrieval at the susceptible circuit locations before revising the inspection interval.
Field Checklist
Crude-unit monitoring and inspection plan
Use this checklist when a crude blend or operating change could alter corrosivity or when monitoring signals and inspection results do not agree.
0 of 5 completed
Knowledge Check
Monitoring and inspection knowledge check
Select the best answer for each question, then submit it to see the reasoning. Pass mark: 70%.
Not yet passed.
Loading quiz…Score: 0 / 0
0 of 0 questions answered
Next Steps
Continue the course
Monitoring and Inspection
Continue to Module 5 to review monitoring methods, inspection evidence, and how to interpret trends.